This is a defensive project, built for authorised laboratory use only. Every scenario it demonstrates runs against a victim container inside its own isolated Docker network, never against a third-party or production system. It contains no offensive malware, no persistence mechanisms, no credential theft, and no detection-evasion tooling. It is built for education, security research, and authorised lab environments, not for scanning or attacking systems the operator does not own or have explicit permission to test.
Overview
Detect, don't guess
Network Attack Visualiser is a graduate-level portfolio project built to demonstrate real networking, cybersecurity, and software-engineering competence rather than to ship a production intrusion-detection system. It ingests network traffic through three interchangeable paths, synthetic events, PCAP replay, and an authenticated live sensor inside a Docker lab, runs two transparent heuristic detectors over that traffic, and presents every detection on a live dashboard with the exact evidence and thresholds that triggered it.
The project's stated priorities, in order, are correctness and honesty (detections are heuristics, never asserted as certainty, confidence is explicitly capped at 0.95), security and privacy by design (only metadata is ever retained; payloads and credentials cannot flow through the system even by accident), clean architecture (capture, detection, alerting, storage, API, and presentation are independent modules with narrow interfaces), and reproducibility (the whole system runs deterministically from a single Docker Compose lab with demonstration scenarios built in).
System Architecture
From a packet to a dashboard alert
Every stage an event passes through, regardless of which of the three ingestion paths it came from.
Ingestion
One of three paths produces the event: synthetic generation for deterministic tests, streamed PCAP replay via Scapy's reader, or an authenticated live sensor sidecar. All three converge on the identical pipeline interface, so detector logic never depends on where an event came from.
PacketEvent normalisation
Every event is reduced to a metadata-only schema: 5-tuple, TCP flags, wire length, and timestamp. The schema has no payload field at all, so packet contents and credentials cannot enter the system even by accident.
Detection engine
A clock-injected engine partitions state by source type and routes events to the portscan and synflood detectors, which perform no I/O of their own and produce identical results whether the traffic is live, replayed, or accelerated.
Candidate alert
A detector that crosses its threshold emits a CandidateAlert carrying the raw detection evidence, the category, and a confidence score.
Alert engine
A cooldown and deduplication gate decides whether the candidate becomes a brand-new alert or reinforces an existing one by the same dedup_key, assigning alert_id and created_at on first creation.
SQLite persistence
The alert record and a pre-aggregated event_stats bucket are written in WAL mode through a single guarded connection. Raw packet events are never persisted, only the alert and the aggregate.
REST API
Health, paginated alert history and detail, and pre-aggregated statistics are all served over REST, so a reconnecting dashboard can always rebuild its full state without touching the WebSocket.
WebSocket broadcast
The moment an alert is committed, alert.created or alert.updated is pushed to every connected dashboard. The socket never replays history on connect, which is deliberate: it avoids replay storms and duplicate-key conflicts in the UI.
Optional AI annotation
A bounded, single-worker annotator can attach a plain-language explanation after the alert already exists, publishing alert.annotated with just the two new fields. It is disabled by default and never sits in the ingest path.
Dashboard reconciliation
The React client loads a REST snapshot on open, subscribes to the WebSocket for live deltas, and reconciles the two streams so the alert feed, charts, and investigation pane stay current without ever double-counting a reconnect.
The heuristic detection engine is the source of truth for every alert. The optional AI layer only ever explains an alert after the fact; it never creates, suppresses, or re-grades one.
Detection Engine
Two detectors, both deterministic, both honest about uncertainty
Both detectors take an injected clock and perform no I/O, so their behaviour under a fake clock in tests is identical to their behaviour under real or accelerated-replay time.
Port scan detector
Tracks each (source_type, src_ip, dst_ip) triplet and counts distinct TCP
destination ports touched by SYN-only packets (SYN=1, ACK=0) inside a 10-second
sliding window. It fires once distinct ports reach 15 within the window, with severity
rising through medium (15-29 ports), high (30-99), to critical (100+). Confidence climbs from
0.60 toward a 0.95 cap as the port count rises past the trigger threshold, never asserted as
certainty.
SYN-flood detector
Watches each destination host and compares SYN volume against the proportion of completed
three-way handshakes, tracked per 4-tuple with a syn_observed flag so an orphan
SYN-ACK can never inflate the count. It fires only when SYN count is high and
completion ratio is low (≥100 SYNs with a completion ratio under 0.2 by default), which is
what keeps it from flagging a busy but healthy server. Severity climbs from medium through
high to critical as volume rises and completion collapses further.
Shared principles. Neither detector ever calls a wall-clock function; both receive
now explicitly. Both partition state by source_type so evidence from
synthetic, replayed, and live traffic never contaminates the same detection window. Both run
periodic expire() sweeps to bound memory, and both reject non-finite configuration
values (NaN, ±Infinity) on load rather than failing silently later. Every threshold below
is a configurable environment value, these are the shipped defaults.
Port scan defaults
PORTSCAN_WINDOW_S 10 · PORTSCAN_MIN_PORTS 15 · PORTSCAN_CRITICAL_PORTS 100 · PORTSCAN_STATE_TTL_S 60 · PORTSCAN_COOLDOWN_S 60
SYN-flood defaults
SYN_WINDOW_S 5 · SYN_MIN_COUNT 100 · SYN_MAX_COMPLETION_RATIO 0.2 · HANDSHAKE_TTL_S 10 · SYN_STATE_TTL_S 30 · SYN_COOLDOWN_S 60
Docker Lab & Network Design
An isolated segment with no route out
Five services split across two Docker bridge networks. The lab network
(172.28.0.0/24, internal: true) has no route to the host or the
internet and holds the victim (unprivileged Nginx, no published ports), the
generator (a Scapy-based traffic tool), and the backend's lab-facing interface. The
management network is a standard bridge carrying operator-facing traffic between the
frontend and backend over Docker service-name DNS.
The sensor does not join either network directly. It runs as
network_mode: "service:victim", sharing the victim's network namespace outright,
which gives it complete visibility into victim-directed traffic without relying on bridge
promiscuous mode or unknown-unicast flooding. Only two ports ever reach the host, and both are
bound to loopback only: the backend at 127.0.0.1:8000 and the dashboard at
127.0.0.1:5173. The victim itself is never published to the host at all.
Security Model
Deny by default, add back the minimum
This is a defensive project, so the way it is built matters as much as what it detects. These are grounded, verified properties, not a claim of formal audit.
Authenticated, fail-closed ingest
The sensor's HTTP POST carries an X-Sensor-Token header checked with hmac.compare_digest for constant-time comparison. A missing or wrong token is rejected before it ever reaches detection logic.
Metadata-only, structurally
The PacketEvent schema simply has no payload field. Passwords, cookies, and credentials cannot flow through the system by accident, because there is nowhere in the schema for them to go.
Least-privilege containers
Every service drops all capabilities by default (cap_drop: [ALL]), runs read-only root filesystems where practical, and never runs privileged: true. Only the sensor and the raw-traffic generator hold a narrowly scoped NET_RAW, chosen deliberately over broader capability sets like SETUID/SETGID.
Ingest hardening
Batches over 200 events, or bodies over roughly 256 KiB, are rejected outright, never truncated. Every event is schema-validated before anything is processed, and live timestamps more than about five minutes skewed from now are rejected as unreasonable.
Self-capture, three layers deep
Because the backend listens on both networks, a kernel BPF filter on the sensor's raw socket, a userspace filter re-applied after parsing, and a backend-side containment check together stop the sensor's own reporting traffic from ever creating a feedback loop with the detector it reports to.
Secrets never committed
SENSOR_TOKEN and friends live only in a git-ignored .env, delivered at runtime through Compose interpolation; CI gates verify no secret ever reaches a build argument, an image layer, or a log line.
Strict CORS and Origin checks
The dashboard origin is allow-listed exactly, never wildcarded, with credentials disabled by default; WebSocket upgrades independently validate the Origin header before the handshake completes.
Verified, not just claimed
Hosted CI gates render every Compose configuration, audit the build context for leaked secrets, and re-check the capability lock on every run; local Docker audits inspect running containers' actual users and dropped capabilities against /proc/[pid]/status.
Optional AI Explanation Layer
Advisory only, and it can never grade its own homework
A provider-abstracted explanation layer can turn an already-persisted alert's sanitised
metadata into a plain-language write-up, but it is disabled by default and the application
works completely without it. The design is deliberately conservative: the sanitiser sends only
allow-listed numeric and enumerated fields to a provider, addresses, alert IDs, raw timestamps,
and anything credential-shaped are stripped before the call ever leaves the process. The
annotator runs as a single bounded worker with a finite queue that drops on overflow rather than
queuing without limit, and it writes back exactly two fields, ai_status and
ai_explanation, after the alert already exists. It cannot create an alert, suppress
one, or change a severity the heuristic engine already assigned.
Frontend Dashboard
Evidence first, not just a red banner
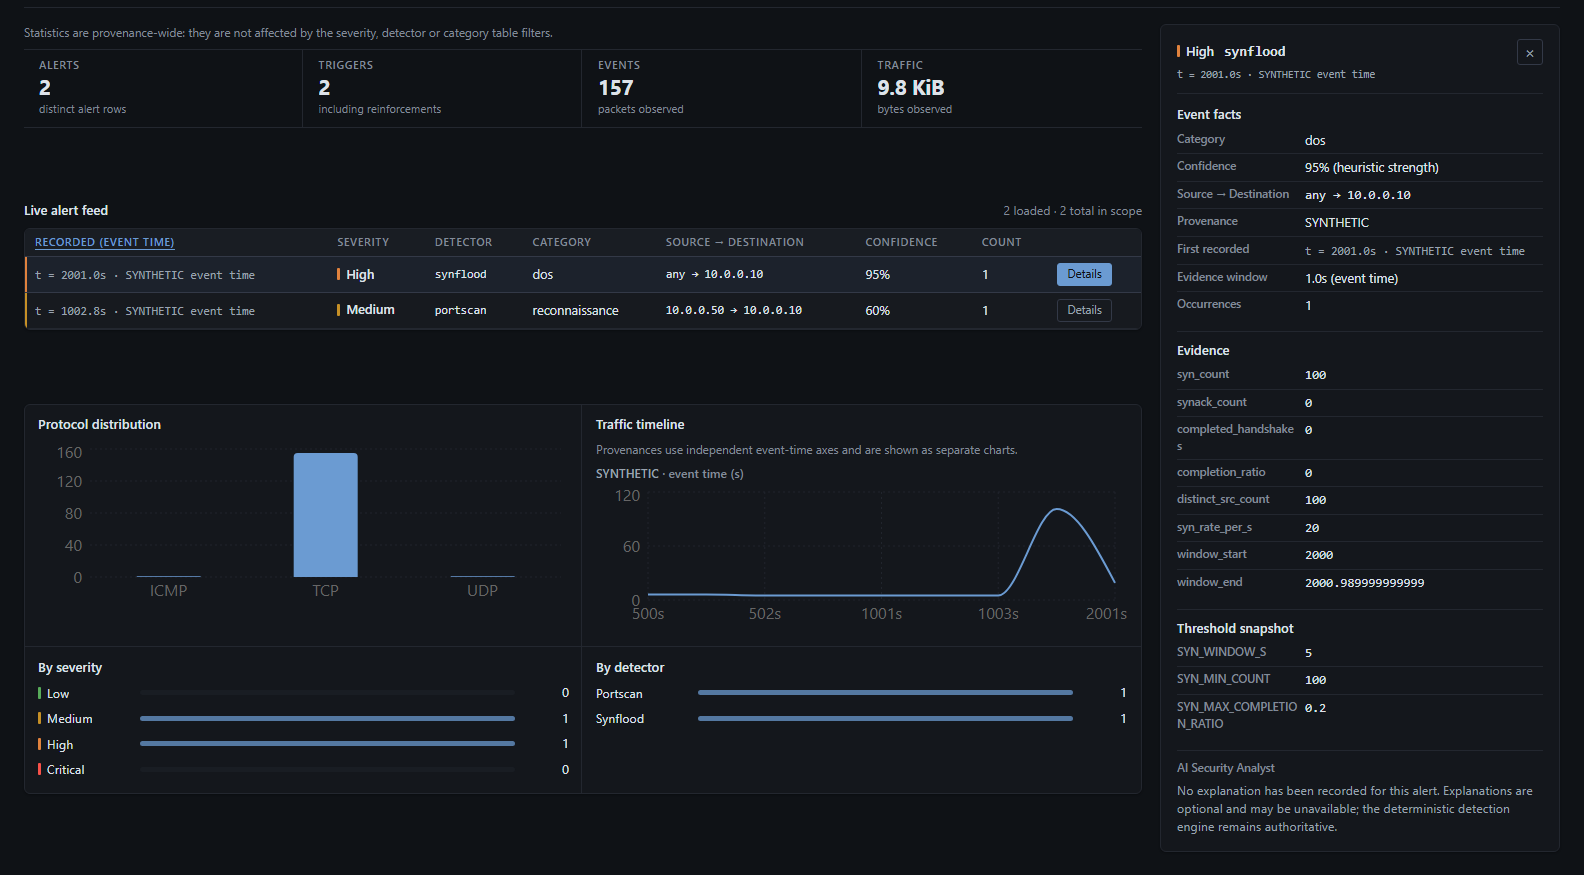
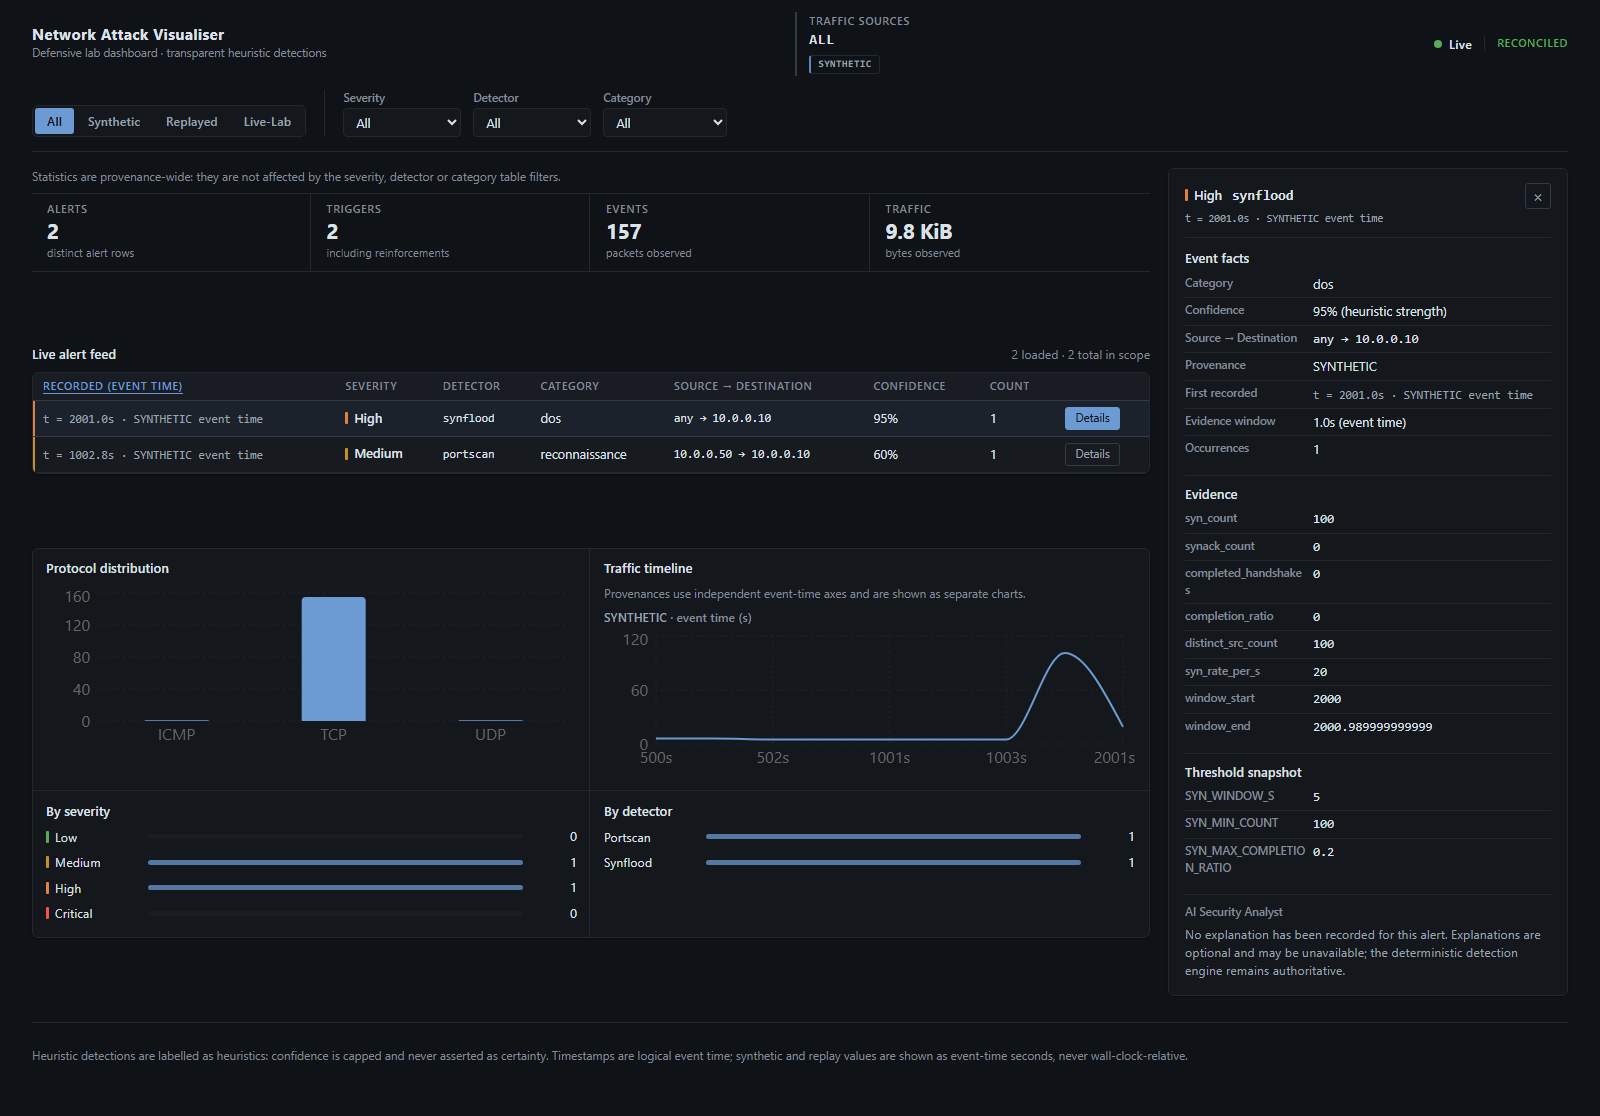
The React and Vite dashboard opens a WebSocket immediately and begins collecting live deltas while an initial REST fetch populates the alert table, a two-phase reconciliation that means a page reload never floods the feed with replayed history. Traffic-source tabs (All, Synthetic, Replayed, Live-Lab) and filters by severity, detector, and category sit above summary tiles for alert count, trigger count, packets observed, and traffic volume, all explicitly scoped as provenance-wide so they are not silently affected by the table's own filters.
Recharts-driven protocol distribution and traffic timeline charts sit below the live feed, with each traffic provenance rendered on its own independent event-time axis rather than mixed onto one wall-clock timeline. Clicking any alert row opens the investigation pane on the right: the exact event facts, the raw evidence counters the detector saw (SYN count, completion ratio, distinct source count), the threshold snapshot that was active when it fired, and, when enabled, the AI layer's explanation, clearly separated from the deterministic facts above it.
Testing & Continuous Integration
Deterministic by construction, not by luck
The single most load-bearing testability decision in the project is that detectors take an
injected clock and perform no I/O. That makes every time-dependent behaviour, window expiry,
TTLs, cooldowns, testable by advancing a FakeClock to an exact boundary instead of
sleeping and hoping. Backend tests run on pytest; the frontend on Vitest and React Testing
Library, with an optional Playwright smoke test.
Unit tests
Schema validation, non-finite config rejection, detector threshold boundaries, and SYN handshake state-machine correctness, all against a fake clock.
Integration tests
Authenticated ingest through to SQLite to REST visibility, cooldown and dedup behaviour (same key within cooldown yields one row with an incremented occurrence count), and WebSocket broadcast of alert.created / alert.updated.
Robustness corpus
A malformed-packet corpus, truncated frames, IPv6, VLAN tags, fragmented IPv4, plus a proof that replay produces identical alerts regardless of playback speed.
Docker/sensor tests
Sensor unit and integration tests with forced live provenance, self-capture filter proofs for both the kernel and userspace layers independently, and image-composition checks confirming the sensor image excludes FastAPI, uvicorn, and sqlite3 entirely.
AI-layer tests
Sanitiser tests proving non-allow-listed fields, including IPs, never reach a provider, plus timeout, rate-limit, and deterministic-fallback handling.
Coverage gate
An enforced ≥85% line-coverage floor on the detection/, alerts/, and models/ modules, the parts of the codebase where a silent regression would matter most.
Challenges & Solutions
Engineering problems worth naming
Challenge
Telling a real attack apart from a busy but healthy server generating similar-looking traffic volume.
Solution
The SYN-flood detector fires only on the combination of high SYN volume and a low handshake-completion ratio, never on volume alone, and every alert carries a bounded confidence score instead of a binary yes/no.
Challenge
The sensor sits inside the network it monitors, so its own reporting traffic to the backend could get mistaken for the attack it is trying to detect.
Solution
A three-layer self-capture filter, kernel BPF, userspace, and backend containment, stops sensor-to-backend traffic from ever entering the detection pipeline.
Challenge
Proving detection logic behaves identically under live traffic, accelerated PCAP replay, and synthetic test events.
Solution
Clock-injected, I/O-free detectors tested against a FakeClock advanced to exact window and TTL boundaries, with an explicit test proving replay speed never changes which alerts fire.
Challenge
Keeping a reconnecting dashboard from flooding its own alert feed with duplicated historical events.
Solution
The WebSocket only ever pushes future deltas and never replays history; a REST fetch supplies the snapshot, and the client reconciles the two streams explicitly.
Challenge
Capturing raw packets needs elevated privileges, which cuts directly against a least-privilege container posture.
Solution
A measured, scoped NET_RAW-only grant, chosen over a broader capability set, verified on every CI run against a locked capability measurement.
Challenge
Adding a useful AI explanation layer without letting it become a second, unaccountable source of truth for what counts as an attack.
Solution
The annotator only ever runs after an alert is already persisted, writes exactly two allow-listed fields, and can never create, suppress, or re-grade an alert the heuristic engine already decided on.
Limitations
What this is not built to do
TCP-focused in V1. UDP-scan detection is out of scope for the current version.
No multi-source correlation. Each detector reasons about one source/destination relationship at a time, not coordinated activity across many sources.
Metadata only, on purpose. There is no deep packet inspection; this is a structural privacy choice, not a missing feature.
Heuristic, never certain. Confidence is capped at 0.95 and detections are explicitly labelled as heuristics, not proof.
Lab-scale storage. SQLite with a single guarded connection means single-writer concurrency and no horizontal scale, an accepted trade-off for a lab-scale tool.
Victim-centric visibility. The sidecar sensor sees what reaches the victim's network namespace, not arbitrary traffic elsewhere on the lab network.
Not a production IDS. No user authentication system, no cloud or production deployment target, and no TLS or reverse proxy in front of it yet, by explicit design in this phase.
Roadmap
What comes after Phase 9
Phase 10 · AI Settings & Analyst
Operator configuration for the explanation layer and an advisory analyst capability, with no change to detection authority or thresholds. Next up.
Phase 11 · Suricata Integration
A Suricata eve.json event reader normalised through the same PacketEvent interface, so signature-based detection can sit alongside the heuristic detectors.
Phase 12 · Hardened Deployment
TLS, a reverse proxy, and authenticated non-loopback exposure, deferred deliberately until the detection and security fundamentals are settled.
Skills Demonstrated
By category
Networking & packet analysis
Security engineering
Backend engineering
Frontend engineering
Software engineering & DevOps
Network Attack Visualiser
Read the code, browse the docs, or review the authorised-use notice
Built solo: detection engineering, backend systems, security architecture, and a real-time dashboard, end to end.